Synthetic Data in Machine Learning: Augmentation and Collapse

Caroline Morton
&
Sam Bennett

September 2, 2026
Imagine you are building a machine learning model to detect a rare condition and find that there are 50 real patients in your dataset who have it. You correctly predict that your model will not perform well on new patients with that condition because the training dataset is too small. So you generate a few hundred synthetic patients with the same condition, retrain the model on the larger dataset, and the performance metrics improve. From your perspective, this is a great use of synthetic data - it improves performance, you are ensuring that rare diseases are more represented in your model, and it should make the model better at picking up the next real patient with that condition. But does it? The answer is: maybe, but maybe not.

In this blog, we are going to be exploring the use of synthetic data in machine learning, particularly thinking about the concept of “model collapse” and the potential risks this poses to health research. We will also discuss some practical steps that researchers can take to mitigate these risks, or at least highlight the risks and hopefully ensure that their models are robust and reliable.
Who are we to start with? Caroline Morton is a senior software developer and epidemiologist, currently undertaking a PhD in synthetic data in health research. Sam Bennett is an Assistant Professor at Durham University, working on an UKRI AI Metascience Unit project investigating how medical synthetic data is shaping research cultures. Together we are exploring the intersection of machine learning, synthetic data, ethics and health research. This blog comes out of several chats we have had recently about the use of synthetic data in health research and we wanted to share our thoughts and concerns with a wider audience.
Why is Synthetic Data used?
The appeal of synthetic data in health research is easy to understand. Health datasets can be small, sparse and hard to share, and mostly for good reasons, whether that is patient privacy or the regulatory barriers around data sharing. There is also the fact that rare diseases are by definition uncommon and some demographic groups have never been recruited into studies in any meaningfully large numbers.

Synthetic medical data work is most established in diagnostic imaging, particularly radiology (Sizikova et al 2024), and it is spreading into harder prognostic problems where the outcome depends on social circumstances as much as it does on biology, such as the work on predictive measures for Alzheimer’s disease (Turrisi and Patane 2026). If you cannot get more real patients with condition A, then generating synthetic patients with condition A looks like the obvious move, and there is a growing literature applying this in practice.
D’Amico et al (2023) developed a generative adversarial network model to generate ‘synthetic cohorts’ of patients with myelodysplastic syndromes (MDS) and Acute Myeloid Leukemia (AML). Running experiments across 4 settings, they generated a synthetic dataset from real data from 2043 patients, generating a new cohort of 2,043 synthetic patients, and reported that this data could “replicate reliable estimates of survival and effectiveness of specific treatments” (L’Amico 2023, p. 9) and that their model’s performance improved as a result, with synthetic data helping “overcome lack/imbalance of information of real Data” (ibid., p. 10) .
The danger comes when training a model on synthetic data, and then using that model’s outputs to train the next generation of models.
The snake eating its own tail
Training new models on synthetic data which has itself been generated by a model creates what we think of as the “snake eating its own tail” problem. A first model trains on real data and generates synthetic data. This synthetic data is then used to train a second model. The training process may stop there or it might be repeated multiple times, with each new model being trained on synthetic data generated by the previous model.
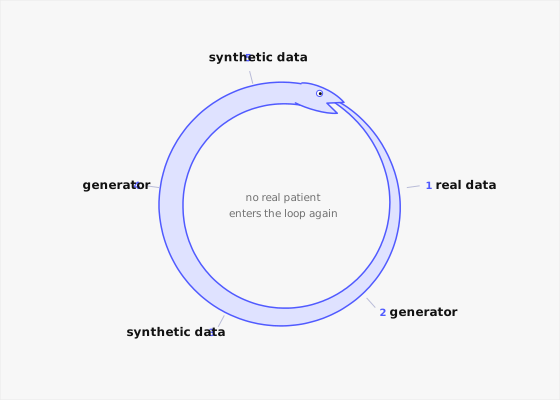
The problem is that a generator does not hand you back the distribution it learned, with the tails included. Instead it hands you a sample drawn from that distribution. The common presentations of a condition are common enough that they will turn up in any sample you take, but the unusual ones sit far enough out right in the tails that they may not turn up at all. Synthetic data generated via Machine Learning (for example, via a Generative Adversarial Network (GAN) or Variational Autoencoders (VAEs)) tends to have a “smoothing” effect, where the generator tends to provide a more average representation of the data it has seen. This means that the model “forgets” the rare but crucial “edge cases” (the tails of the distribution) and converges on the most common, average representations.
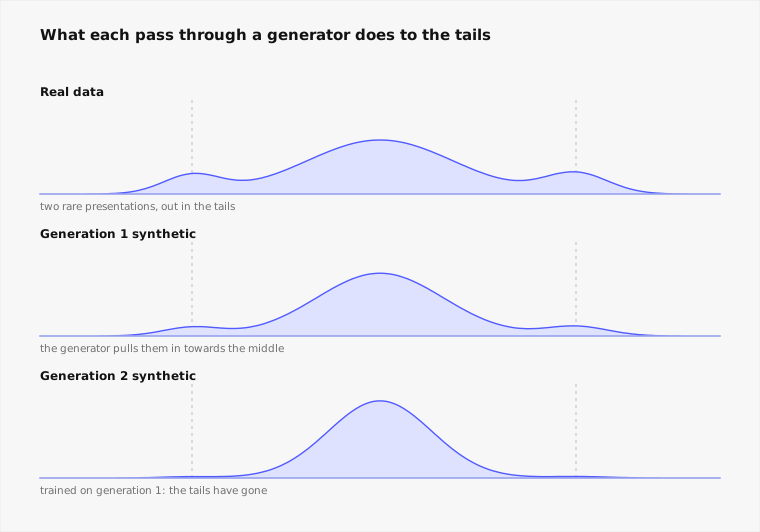
Now we take our more average synthetic data and train our diagnostic model on it. This model tends to suffer from a similar smoothing effect, meaning it is more likely to diagnose the average patient because it has more opportunities to learn what they look like, compared to the rare patient. Now we might get away with this at this point. But then what if we take the output of this model, repurpose it to generate even more fake data and use it to generate more synthetic data, and then train a new model on that?
We have now created a feedback loop, where the model is learning from its own outputs, and the error compounds across generations until the tails have gone. The model has collapsed to the mean, and it is now less able to diagnose the very patients it was built to help. This is what we mean by model collapse.
Worked example
Let’s think about a worked (and made up) example. Let’s imagine that we want to create a tool to help better diagnose emergency room attendances of Guillain-Barré Syndrome (GBS), which is a rare autoimmune condition that can cause paralysis. It has a range of unusual presentations, and the early symptoms can be very similar to other conditions. It is hard to diagnose and therefore it makes sense that we would want a tool to help us do it. The presentation most clinicians will think of first is a progressive and roughly symmetrical weakness which starts in the legs and moves upwards, often a week or two after a diarrhoeal or respiratory illness. But there are rarer variants such as the Miller Fisher variant where patients have eye symptoms and may have very little limb weakness at all. Those are the patients a diagnostic tool would be most useful for, because they are the ones least likely to be picked up because the presentation is non-classical.
If we have an original dataset of 50 real patients with GBS mixed in with 10,000 patients without GBS, we might decide that we don’t have enough data to train a model which can reliably diagnose GBS. We therefore decide to generate synthetic patients with GBS to augment our dataset. In this case, we might generate 950 synthetic patients with GBS to improve our model’s performance, bringing the prevalence of GBS in the training dataset up from 0.5% to just over 9%. We check that our synthetic data generator has produced realistic patients. The synthetic patients have much the same distribution of ages, symptoms and test results as the real ones. Every column looks right when we do this: the ages match, the proportion with a preceding infection matches, test findings, and so on and so forth. (We will come back later to see how much that check is actually telling us). We then take our new augmented dataset and train a new model for diagnosing GBS. The model performs well on our validation set, and we are happy with the results.
It is worth looking at what has happened to the GBS patients. There are now 1,000 of them and 950 came out of a generator, so 95% of what the model can learn about GBS it is learning from a model rather than from a real patient, and the generator itself only ever saw the original 50. Now there are some obvious problems here that are not model collapse. If one of the unusual presentations of GBS - the presentations which are the reason a diagnostic tool would be worth building in the first place - was not among those 50 patients, then it is not under-represented in the synthetic data, it is just absent. The generator cannot generate what it has never seen. That is a normal consequence of any research - we can’t know what we don’t know.
But there is also a more subtle problem here, which is that the generator has generated a smoothed version of the 50 patients it has seen - the average patient, the average presentation, the average test result. Say that two of our 50 real patients had the Miller Fisher variant, so they had the eye signs and almost no limb weakness. Those two patients sit a long way from the other 48 and a generator fitted to all 50 will tend to pull them towards the rest rather than reproduce them. The result is that the generator produces somewhat hybrid patients, who have some of the eye signs but also the limb weakness of the majority of patients.
Our diagnostic model then learns from this smoothed version of the real patients and learns to diagnose the average patient rather than the rare one. The model has moved towards the mean, and it is now less able to diagnose the very patients it was built to help.
That is the first turn of the loop. But since we are talking about model collapse, let’s take it a step further. Let’s imagine that since our augmented dataset is mostly made up of synthetic patients, it is allowed to be shared with other researchers (there are caveats around this, but we will ignore them for now for this example). It also contains 1,000 GBS patients rather than 50, which may well make it the largest GBS dataset that anyone outside the original team can get hold of. So another research group picks it up, trains their own generator on it, and produces 10,000 synthetic GBS patients for a different research question. Their generator has never seen our 50 real patients, it has only seen our smoothed version of them, and it smooths again, so by this point the Miller Fisher patient has been averaged away twice over. This is model collapse in action, where the tails of the distribution have been clipped and rare patients are no longer represented in the synthetic data.
Model Collapse vs Mode Collapse
We are just going to pause here to separate out what we are talking about “model collapse” from a similar term, “mode collapse”. Unfortunately they have very similar names and are both involved in synthetic data which makes it confusing!
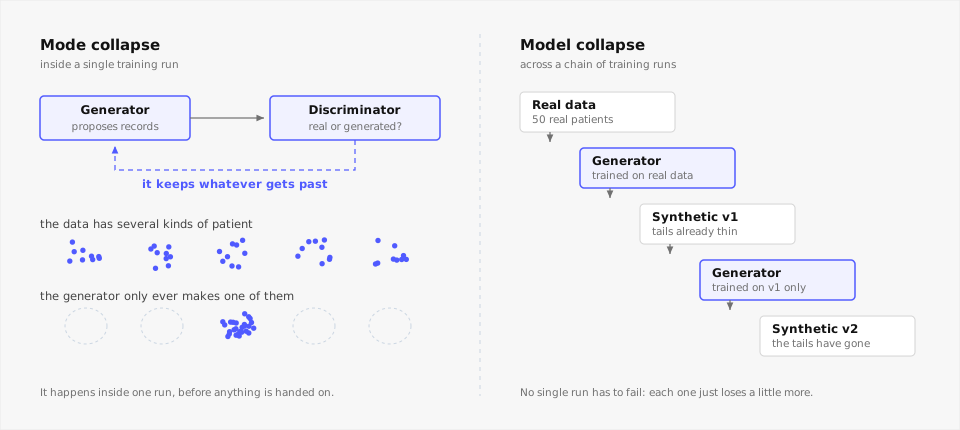
Mode collapse happens inside a single training run, usually when training a GAN. Just as a quick recap, a GAN is made of two things: A generator that tries to make synthetic data, and a discriminator that tries to figure out if a particular data item is fake or real. As the GAN processes, the generator gets better at producing more realistic data and fooling the discriminator into believing that what it is producing is real data. Mode collapse happens when the generator finds a narrow set of outputs which reliably fool the discriminator and then stops producing anything else but that. The result is a dataset made up of one particular subset of the population that just happens to be good at fooling the discriminator.
Model collapse, which is what we are talking about in this blog, is a property of the pipeline rather than of any one training run. It is what happens when the output of one model becomes the training data for the next, and then for the one after that, with the error accumulating across generations until the tails have gone.
The two can happen together, since a generator which has suffered mode collapse will produce a dataset that is a poor basis for training anything else. The smoothing we have described above is more mild than mode collapse. The generator is still covering the range of data it was shown, only with less of the variation that sat out at the edges or tails of the distribution.
What do we do as researchers?
So where does this leave us? Let’s talk through some options or suggestions.
Treat the Synthetic-to-Real Ratio as a Hyperparameter
Throughout the processes of creating and using synthetic data, we should be mindful that the ratio of synthetic to real data in our training sets form a critical variable that fundamentally alters model behavior, and reflect this in our documentation.
Action: Treat this ratio as a hyperparameter - explicitly test and report model performance at different mixtures (e.g., 90% real / 10% synthetic vs. 50% real / 50% synthetic) so that users and auditors can understand the ‘tipping point’ of utility.
Always Validate Against held-out real-world data
Never validate models on synthetic data. This is because when a model has a systemic bias or hallucination, and the diagnostic model on synthetic data is validated by data generated by that same system, the resultant validation metrics will look great but the model will likely fail when used in a real-world setting.
Action: Always hold out a real-world dataset for final validation. If you don’t have enough real data to hold some out for testing, you do not have enough data to safely validate your model.
For Tabular Data: Look Beyond Marginal Fidelity
When evaluating synthetic tabular clinical data (like electronic health records), many researchers rely on marginal fidelity, aka checking if the synthetic data has the same sort of distribution as the real data - however, good evaluation practices should go beyond this.
Action: Use utility metrics that go beyond marginal fidelity (for example to evaluate joint distributions and feature correlations?) For a deeper dive on how to implement these robust metrics, check out this comprehensive guide on clinical utility metrics here (or reach out to coordinate).
For Unstructured Data: Focus on Clinical Consistency
What happens when we truly do not have a clean, real-world holdout set, e.g. unstructured patient progress notes where privacy concerns prevent any raw data sharing? For unstructured data like scans or clinical notes, traditional pixel/token-level similarity metrics (like FID or BLEU scores) are insufficient, and evaluation needs to be contextually situated and involve more qualitative judgements of suitability. These proposed evaluation approaches should be treated with a lot of care, especially given the difficulty in assessing how slight linguistic differences shift the nature of clinical notes for example.
Action: Use downstream task utility (e.g. does a model trained on synthetic images perform well on real images?) and clinical/patient auditing (e.g. observe how well clinicians distinguish real from synthetic, rating them on clinical plausibility, without knowing if the data is synthetic or real, and potentially how patient groups corroborate the notes contents as similar in synthetic vs real contexts).
An Alternative Approach: Synthetic Data as Curation
We view the generation of synthetic data as an active act of curation. It is curation that fundamentally alters the historical record i.e. by changing the constitution of the dataset. As such, we propose that we treat this process as a key well described data processing step that is as important as our research methods.
To do this responsibly, we signpost a combined Model Card + Datasheet approach, drawing on the work of Gebru et al (2021) on datasheets for datasets and Mitchell et al (2019) on model cards. Datasheets documents the metadata of dataset development, via answering a series of questions about the aims of the dataset, the process of creating it, its composition, and recommended uses amongst other information future users and other stakeholders may be interested in (Gebru et al, 2019). Model cards take a similar approach, creating information about how and why a model is created, and points for people to reflect on when they use and adapt the model (learn more here).
We believe that pairing these proposed tools together provides essential context for people using synthetic datasets:
| Approach | Purpose/Aim |
|---|---|
| Datasheet for Dataset | Document the provenance of the seed data, the types of models used, the filtering steps applied, and known biases in the synthetic generation processes |
| Model Card | Detail the limitations of the generator itself, its training parameters, and its failure modes. |
Conclusion: Silver Bullet or Ticking Timebomb?
So, where does this leave us - is synthetic data a clinical silver bullet, or a slow-burning regulatory and methodological timebomb? We do not have good enough answers yet…right now: the breakneck pace of AI adoption in healthcare is outrunning the slow, rigorous methodological work required to make it safe. However we can guard against the risk as best we can by being open and transparent about what data has trained which model, and being really clear about the percentage of synthetic data that is being used in that training set, and how that was in itself made. Utility and representativeness metrics and looking at the tails of distributions of your generated data compared to the real data are helpful to quantifying what issues you might have, and allowing you to change parameters to optimise the validity of your synthetic data. Key to this is grounding synthetic data generation in a deep understanding of the (practical) medical context of data development and use, sharing this context with any future users via tools such as datasheets and model cards.
The key thing here is to be open and honest about what data has gone into which model, and to be clear about the provenance of that data. It is too easy to take a dataset to use to train a ML model that is labelled as health data and not realise that in fact, this dataset is 95% synthetic data. Or that it is data that is derived from several generations of synthetic data processes. In the absence of clear metrics to assess provendence, we suggest that we just report openly where data came from as a minimum and be skeptical of new and large datasets that contain patients that you know are hard to collect data on - such as rare diseases or certain populations.
In summary, synthetic data holds great promise for advancing AI in healthcare, but it comes with significant risks and responsibilities. This post is part of a longer series exploring the challenges, methodologies, and best practices for using synthetic data responsibly in health research, that you can check out here. This is a recommended starting point for anyone interested in the intersection of synthetic data, machine learning, and health research.
Enjoyed this? Subscribe to my newsletter.
I write about open science, research code, and building better tools for researchers.