Fairness and Bias Amplification in Synthetic Data

Caroline Morton

August 5, 2026
A synthetic dataset is fair when it represents every group of patients well enough that the conclusions drawn from it still apply to the real people in each group. This is hard to guarantee because most bias in health data is inherited. Bias exists in the real records before any model is trained, so in the generation process the generator more often than not reproduces it in the synthetic data. I describe where the inherited bias comes from in my blog on bias in synthetic data, and in more general terms in my primer on bias.
This blog builds on those blogs and is specifically about bias amplification. It’s a more challenging form of bias because the generator does not just reproduce the existing skew, it enlarges it. This is described as a problem of fairness because the groups misrepresented are usually the ones underserved in the real data.
Why does generation make bias worse?
A generator learns best from the data it sees most often. The patterns within the majority are reinforced thousands of times and reproduced reliably, while the patterns within a small subgroup are seen rarely and, as such, learned weakly. Inheritance is the mild version of this, where a skew in the training data carries through to the generated output. Amplification, however, is the step beyond this, because when you sample from a model that has under-learned a group, you get even fewer of those records than the training data held.
Let’s work through an example. Imagine a training set of 5,000 patients with type 2 diabetes, of whom 250 belong to a minority ethnic group whose response to a common medication differs from the majority. The generator sees the majority pattern thousands of times, but the minority pattern in only 5% of the records. It cannot capture the variation within such a small group, so it leans towards the average and treats the difference as noise.
| Group | Real training data | Synthetic data |
|---|---|---|
| Majority | 4,750 (95%) | 4,900 (98%) |
| Minority ethnic group | 250 (5%) | 100 (2%) |
| Total | 5,000 | 5,000 |
In the synthetic data the minority group is smaller, and the distinctive treatment response that set those patients apart is lost or diminished. A prediction model trained on that synthetic data would predict poorly for exactly the patients whose care depended on the difference, because this small group barely shifts the overall distribution. As such, the loss would likely slip past any check that looked at the dataset as a whole. This is what we mean when we talk about a loss of fairness.
Is fairness the same as representativeness?
Not quite. In my article on representativeness I discuss how representativeness is measured against the whole population, and in my article on measuring utility, how utility is measured against a task. Fairness is measured across subgroups.
| Dimension | The question it asks | Measured against |
|---|---|---|
| Representativeness | Does the data reflect the population it models? | The whole population |
| Utility | Is the data good enough for the job at hand? | A specific task |
| Fairness | Does the data represent each subgroup well enough that conclusions hold for the real people in it? | Subgroups defined by attributes like age, sex, and ethnicity |
The way I think about it is that a dataset is a map of the population it describes. Representativeness asks whether that map is accurate across the whole territory, while fairness asks whether it is accurate in every neighbourhood, right down to the smallest streets. That is why a dataset can look strong on the first two dimensions and still fail the third, matching the population on average and serving a general task well, while misrepresenting a group that makes up a small share of the records.
Why do the usual checks miss it?

Because the usual checks look at the population as a whole, and amplification hides in the subgroups. A validation of Synthea by Chen and colleagues shows this. The demographics and the procedure-based measures, such as cancer screening rates, lined up closely with national benchmarks. It was only in the outcome-based measures, such as complication rates and mortality, that real discrepancies appeared. The data passed every check that looked at the population as a whole and failed the ones that looked at what happened to patients.
This is why fairness has to be measured at the level of the groups you care about. Bhanot and colleagues built two fairness metrics for exactly this, comparing each subgroup in the synthetic data against the real data rather than settling for one global score. They tested the metrics on a synthetic version of MIMIC-III, a widely used critical care database, that had been generated by a model called HealthGAN. The metrics showed that certain racial groups, and patients who had died, appeared less often than they did in the real records.
The largest discrepancy from the real data appeared where several under-represented traits overlapped. In this study, the underrepresented group was made up of patients who were Black, female, aged 66 to 80, and who had died. It is worth understanding why that particular combination suffers most. On any single trait, the group is thinned but survives, because the generator still sees enough examples to learn from. A patient who is only one of these things, say a 30-year-old white man who died, sits in an otherwise well-populated part of the data, so the generator reproduces him with little loss. But a patient who is all four at once sits in the overlap of four thin groups, a pocket with almost no examples in it, and that is where the generator reproduces records worst of all. The more under-served groups a patient belongs to, the more the synthetic data loses them.
So how do we correct it?
The good news is that once you can detect amplification, you can correct it.
- Fixing fairness for the missing groups
Draghi and colleagues built a method called BayesBoost and applied it to a large UK primary care dataset from CPRD, covering nearly 500,000 patients. It works in two stages. Firstly, it uses uncertainty analysis to find the groups the data underrepresents. Secondly, it generates extra synthetic records for those groups, and it does this in a way that the researcher can tune. The corrected data aims to match the original distributions while improving the representation of the groups that were thin to begin with. In this way, synthetic data becomes the fix rather than the cause, though deliberately oversampling underserved groups is a choice with consequences for privacy that I discuss in the privacy-utility tradeoff.
- Building fairness from the start
Another approach is to build the correction into the generator itself. A model called Bt-GAN adds fairness constraints during training and uses a rejection step to keep subgroups in balance, so fair representation is a design goal rather than an afterthought.
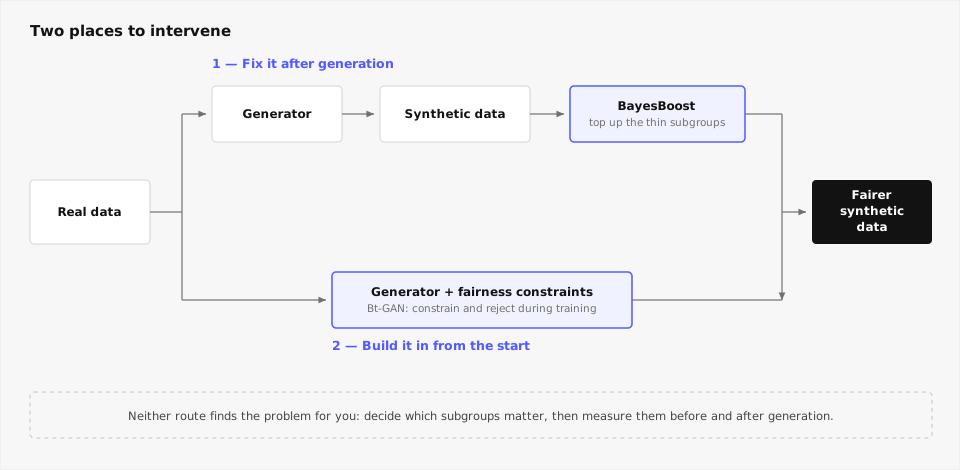
No matter which approach you choose, neither method will find the problem on its own. Each approach depends on someone deciding in advance which groups matter to them and assessing them for fairness before and after data generation.
Summary
The important point running through all of this is that fairness has to be looked for deliberately. A generator will not surface an under-represented group on its own, and a check that looks only at the whole dataset will not catch one either. More importantly, a generator that amplifies bias is doing exactly what it was built to do, which is why the problem only shows up when you look closely at each subgroup, and why it is worse where several disadvantages overlap.
The practical answer is to decide up front which groups your work depends on, measure them before and after generation, and correct imbalances where you find them.
Further reading
This blog is part of a wider series on synthetic data, which you can find here. It follows on from my blog on bias in synthetic data, and pairs with my articles on representativeness and measuring utility. Please don’t hesitate to reach out if you have a specific question or are interested in learning more about synthetic data.
Enjoyed this? Subscribe to my newsletter.
I write about open science, research code, and building better tools for researchers.