Bias in Synthetic Data

Caroline Morton

July 16, 2026
At this point bias is a well-known problem in health data. I have written previously about what bias is and the different types of bias in our datasets. It is worth reading my previous primer on bias if you are new to the topic or just want a refresher. In this blog, I am going to be putting synthetic data under the microscope, and looking at how bias enters the generation process, and what it does once it is there.
Bias starts in the real world
There are many different ways that synthetic data can be created but the most common approach is to use machine learning to generate new records based on the patterns it has learnt from the real data. The most commonly used approach within the broader category of machine learning is called a generative adversarial network (GAN). I have written about GANs in a previous blog, and you can find that here.
The short version is that a GAN is made up of two neural networks, one that generates new records and one that tries to tell the difference between real and synthetic records. The generator learns to produce records that are increasingly difficult for the discriminator to tell apart from the real data, and the discriminator learns to get better at spotting the fakes. The result is a generator that can produce new records that look like they could have come from the original dataset. The key thing here is that the generator is learning from the real data, and if that data is biased, then the synthetic output will be biased too.
We already know that we don’t have a complete dataset of the population - I would argue that such a thing is impossible to achieve - but rather we have a dataset that is a sample of the population. That sample is not random as it is the result of a series of choices and circumstances that determine who is included and who is not. This could be quite varied. Maybe our data only includes people who have a GP, and therefore we miss people who don’t have access to healthcare. Maybe our data only includes people who have been admitted to hospital, and therefore we miss people who are treated in the community. There are endless options here. As I have argued, our data is the map of the population, but it is not the territory itself. The map is always a simplification of the territory, and it is always incomplete.
The issue is that no generator, however sophisticated, can recover information that isn’t collected in the first place. If the sample doesn’t reflect the population, then nothing downstream will fix that. An illustrative example is about alcohol consumption. If we look at self-reported drinking, we see that it is systematically lower than actual consumption. Research comparing survey responses with actual sales found that self-reported drinking accounts for only around 60% of the alcohol sold in England, which means a generator trained on survey data would reproduce consumption rates that look complete and plausible, while understating how much people really drink. The lesson to take from this is that bias starts in the real world and can be carried over into synthetic data.
Specific biases in synthetic data
I have a table in my previous blog on bias that sets out the different types of bias you are likely to encounter in health data, with some examples. Below is a similar looking table but examining how those biases enter the synthetic data generation process, and what happens to them once they are there.
| Bias type | What it means | Where it comes from in health data | What a generator does with it |
|---|---|---|---|
| Selection bias | The people in the dataset are not the people the study is about | The dataset only covers one route into care, so hospital records capture only the patients who reach hospital | Reproduces the same skew, since it can only learn the population it was shown |
| Non-response bias | The people who took part differ from those who did not | Participation is not random, and survey non-participants tend to have worse health than participants | Reproduces the skew, treating the participants as if they were the whole population |
| Measurement bias | The recorded value differs systematically from the true one | The recording process is imperfect, so self-reported drinking understates true consumption | Reproduces the error, and can exacerbate it |
| Informative missingness | The missing values are not missing at random | The gaps themselves follow a pattern, so recording of indicators like smoking status is incomplete in ways tied to patient characteristics | Learns the pattern of missingness as though it were real signal |
| Collider bias | A spurious relationship appears between two variables | The dataset is conditioned on a third variable, such as only including patients who have been admitted to hospital | Reproduces the spurious relationship, which can be mistaken for a real one |
| Survivorship bias | Only the people who survive to be included are represented | The dataset only includes people who have survived a certain event, such as patients who have survived a particular treatment or disease | Reproduces the skew |
| Representation bias | A group is too small for its patterns to be learned reliably | The source data thinly covers some groups, such as rare diseases or minority ethnic groups | Under-generates or blurs those groups |
| Bias amplification | An existing skew becomes larger in the output | The generation step itself, which can shrink an already small subgroup further | Adds distortion on top of what the data already contained |
I want to draw your attention to the fact that the first 6 of these exist before any generator is involved. They are properties of how the data was collected, and they would affect a conventional analysis just as much as a synthetic one. I talk about these in more general terms in my previous blog, and I won’t go into them in detail here. The last two rows, however, have specific implications for synthetic data, because they describe what can happen inside the generation step itself. Representation bias is a problem that also is an issue in conventional analysis, but it is particularly important for synthetic data.
Representation bias

Representation bias is an issue of course when our study population is not well represented in the sample or source data. That is a well known issue in epidemiology. When it comes to synthetic data, it is particularly important to be mindful of because of how generators tend to work. To understand why this happens, it helps to know that a generator learns best when the data covers the population well. The patterns and relationships within the majority are seen thousands of times during training, so they are reproduced reliably, whereas the patterns of a small subgroup are seen rarely and reproduced weakly, or not at all. This is the mechanism by which a skew in the training data becomes a bigger skew in the synthetic output. Nothing malicious is happening, but the model reproduces most faithfully whatever it sees most often, which is also why models generating synthetic hospital records have struggled to reproduce smaller and underrepresented groups, even when the overall data quality looked robust.
Bias amplification
Bias amplification is a closely tied issue that has the potential to be even more problematic if not guarded against. It occurs not only when the source data is skewed, but when the generation step itself adds distortion on top of what the data already contained. Let’s talk through a hypothetical example to really understand this. Imagine we are generating synthetic blood test results from a dataset of real patient records. The source data is already skewed, with a small number of patients who are younger than 40, since young people tend to be healthier and less likely to be admitted to hospital. As a result the blood tests that are in the dataset tend to come from the most unwell young patients and the generator learns that pattern.
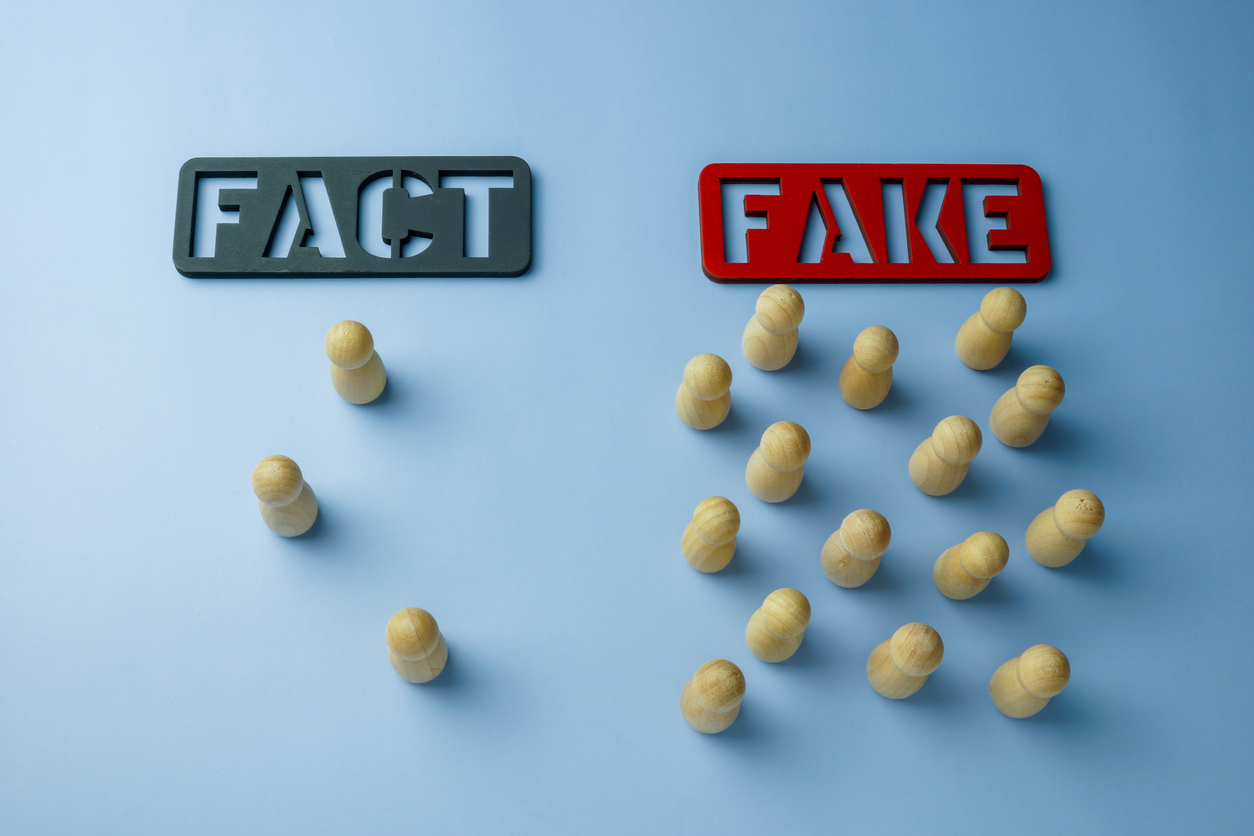
But it does more than learn it. Say the source has 200 young patients: 80% with abnormal results, and 20% near-normal outliers who were admitted for reasons that had little to do with their bloods. Seeing so few young patients overall, the generator has no reliable signal for the variance within that subgroup, so it fits the central tendency and treats the near-normal cases as noise. They get smoothed away. The synthetic young cohort comes out 97% abnormal. A tendency in the source has hardened into a near-rule in the output. Downstream, anyone training a triage model on this synthetic data now believes young patients essentially never present normally - and the tail that was thin to begin with in the real dataset has been cut off entirely in the synthetic version.
The HealthGAN study measured exactly this. Bhanot and colleagues applied fairness metrics across three datasets, including MIMIC-III, and found subgroups both under- and over-represented in the synthetic versions, with the biases of the source data carried through into the output, and in places, amplified. In my article on representativeness, I described bias amplification as invisible, unless you’re specifically looking for it, and this study is a good example of why. Every aggregate check on the HealthGAN data could pass, while the subgroup-level picture got worse. The lesson here is that bias in synthetic data has to be measured at the level of the groups you care about, not the dataset as a whole.
Amplification isn’t the only distortion generation can add, either. In my article on GANs, I described mode collapse, where a generator gets stuck producing a narrow range of similar records. This is when the generator finds a profile that reliably fools the discriminator, and keeps producing it, while skipping over other profiles entirely.
How big of a problem is this?
Returning to Bhanot and colleagues, it is worth looking more closely at what they found. Their synthetic records were generated from MIMIC-III, one of the most widely used critical care databases in the world, and HealthGAN did its job well by most of the usual measures. But when the researchers checked how different patient subgroups were represented in the synthetic output, they found that certain racial groups, as well as patients who had died, appeared less often than they did in the real data. Nothing had gone wrong with the generator, in fact it was working just as designed. However, it had not simply reproduced the make-up of the real data, it had deviated from it, ending up less representative of some groups than the data it was trained on.
Summary
Once bias is inside the training data, it is reproduced, and can be made worse by a generation process that has no way of knowing which parts of the data it should not be learning from. Correcting it is possible, and I will look at how we do this in a later article on fairness and bias amplification. However, the generator will never do it for you by itself, or warn you when or if it is needed.
This also explains why the question “Is this data biased?” is the wrong question in the first place, because every dataset is biased in some direction. The useful questions are narrower ones, such as:
- Biased in which sense?
- Against whom?
- Does that particular skew matter for what you are going to do with the data?
For example, a synthetic dataset used for software testing might be able to tolerate biases that would be disqualifying in a dataset used for training a clinical prediction model. This is the same use-case-first logic I set out in my article on measuring utility, and it applies just as strongly to bias. The bias issue only becomes manageable once you stop treating it as one problem and start treating it as several layers of bias, each with its own point of entry.
Further reading
This blog is part of a wider series on synthetic data, which you can find here. If you are new to synthetic data, I recommend starting with my introduction to synthetic data and the use cases blogs, and please feel free to reach out to me any time via my contact page if you have questions or want to discuss synthetic data in more detail.
Enjoyed this? Subscribe to my newsletter.
I write about open science, research code, and building better tools for researchers.