What is a confounder, really?

Caroline Morton

August 27, 2026
The term confounding gets used a lot in health data research, usually in the context of it being something that makes our results more confusing to understand. If we don’t control for confounding, we can’t understand the results that we get, or we might not believe it. It is a hugely important part of health data research, and many discussions of results are couched in terms of whether confounding has been accounted for. I’ve written this primer on confounding because it is something that is often misunderstood, mixed up with other concepts like bias and can be be used in a looser sense to mean “something that makes the results confusing or inaccurate”. In my view, this is not a helpful way to think about it, because it doesn’t give you any insight into what is actually going on or how to fix it. Confounding actually has a very specific meaning, and once you can spot it, you can usually do something about it. So firstly, let’s discuss what actually is a confounder.
What makes something a confounder?
A confounder is a variable that has an outside influence on a result. It’s linked to both the thing you’re studying (exposure) and the outcome you’re measuring (outcome), but importantly is not on the causal pathway between them.
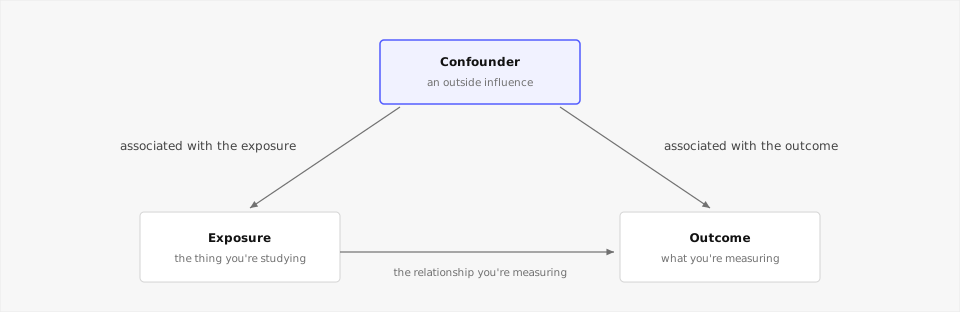
One widely used classical example used to explain confounding, looks at the prevalence of Down syndrome in first-born babies, versus those born later. At first, it looks like Down syndrome risk increased with birth order, as though something about being born later in the family raised the chance of having Down syndrome. However, in this example, birth order itself was not the cause, the confounder was maternal age. Women are older by the time they have their third or fourth babies, and the risk of Down syndrome increases with a mother’s age. So in this example, once the researchers adjusted for maternal age, the birth-order effect disappears entirely. This is a classic example of confounding, where the confounder (maternal age) is associated with both the exposure (birth order) and the outcome (Down syndrome), but is not on the causal pathway between them.
How to confound
For variables to act as confounders, three things must be true. In the table below, the exposure is the thing we’re studying (e.g. birth order), and the outcome is what we’re measuring (e.g. the chance of Down syndrome).
| Condition for a confounder | In the Down syndrome example |
|---|---|
| It has to be associated with the exposure | Maternal age is associated with birth order. |
| It has to be associated with the outcome on its own | The chance of Down syndrome increases with maternal age, regardless of birth order. |
| It cannot be a consequence of the exposure | Being a later child does not make a mother older. |
That third point is important, because it is what separates a confounder from the other variables. A confounder sits outside the pathway you are trying to study, that is, it cannot be on the causal pathway between them. However, because it is related to both sides of that pathway, it can make two things look more strongly related, less strongly related, or even related when they are not.
What is not a confounder?
A confounder is most commonly mistaken for two other kinds of variable, a mediator and a collider. Telling them apart helps you decide whether you should adjust for it, and how to do that. Let’s quickly review mediators and colliders, so you can see how they compare:
-
A mediator is the variable through which the exposure produces its effect. For example, if exercise lowers blood pressure and lower blood pressure reduces heart disease, then blood pressure is a mediator on that path. If you adjust for blood pressure, then you make exercise look less impactful on heart disease than it is.
-
A collider is different from a confounder, as it is caused by the exposure and the outcome. Take two completely separate clinical concerns, a broken hand and gallstones for example. Each one raises your chance of being admitted to hospital, so if you looked at admitted patients, you might think that the two are linked. However, in this example, admission would be thought of as a collider, that is, by restricting your view to the group of admitted patients you have conditioned on it and conjured a connection that is not real. I go into this properly in my explainer on bias in health data research.
| Role | What it is | What you should do with it |
|---|---|---|
| Confounder | Associated with both the exposure and the outcome | Adjust for it. Leaving it in will bias the estimate. |
| Mediator | A step on the causal path from exposure to outcome | Do not adjust for it. Adjusting it hides part of the real effect. |
| Collider | A shared effect of the exposure and the outcome | Do not adjust for it. Adjusting it invents an association that is not there. |
While the difference between these variables can be a bit confusing, I find a simple way of thinking about their differences is to map the relationships between them.
Confounder: birth order — maternal age → Down syndrome
**Maternal age is associated with birth order and impacts Down syndrome**
Mediator: exercise → blood pressure → heart disease
**Exercise impacts blood pressure, which impacts heart disease**
Collider broken hand → hospital admission ← gallstones
**Broken hands and gallstones impact hospital admission**
Worked example: Kidney stones confounder
The table below comes from a real comparison of two kidney-stone treatments, open surgery and a keyhole procedure called percutaneous nephrolithotomy. Julious and Mullee used this example to show confounding at work in clinical data.
| Small stones | Large stones | Overall | |
|---|---|---|---|
| Open surgery | 93% (81/87) | 73% (192/263) | 78% (273/350) |
| Keyhole procedure | 87% (234/270) | 69% (55/80) | 83% (289/350) |
If you look at the two stone sizes in the columns separately, you can see that open surgery appears to be the best approach, i.e. 93% vs 87% in the small stones column, and 73% vs 69% in the large stone column. However, if you read the table across the rows, you can see that the keyhole procedure performs better than open surgery (83% vs 78%). As both treatments cannot be the better one, we know something has gone wrong.
The confounder here is stone size. Surgeons used open surgery more often for the harder large stones where success is lower for everyone. Meanwhile they used the keyhole procedure mostly on the easier small stones. Stone size drives both the choice of treatment and the chance of success, which is exactly the pattern of a confounder.
Confounder: type of surgery ← stone size → success rate
**Stone size impacts the type of surgery chosen and the surgical success rate**
What we do about confounding
If we know that a confounder is present then we have options regarding how to deal with it. Firstly, at the design stage we can restrict the study to one level of it (i.e. remove it), match participants on it so that it is balanced between groups, or run a randomised trial to prevent it being systematically associated with the exposure.
Secondly, at the analysis stage we can stratify, as we did with the kidney stone table, or adjust for it in a regression model. With the exception of randomisation, these approaches depend on us identifying and measuring the confounder in the first place. If we aren’t aware of the confounder, or only measure it roughly, some of its impact can remain. This is called residual confounding, and it is why adjusting for confounding is not the same as removing it.
Which brings me to the most important takeaway from this explainer. You cannot find a confounder by looking at your data, because a confounder, a mediator and a collider can all produce very similar results. The only way to tell them apart is to know the causal story behind the variables, and that comes from you, and your understanding of the subject, not from the dataset. This is one of those things that makes health data research so interesting, and in a way hard to automate with AI. It is also why it is so important to have domain knowledge when working with health data, and why I think it is a good idea to have a clinical expert on your team if you are doing health data research.
Further reading
If you want to read more about some of the ideas in this explainer, I recommend starting with my explainer on bias in health data research, where I touch on collider bias in more detail. My articles on electronic health records and codelists are also useful background for understanding where confounders come from and how we define the variables used in a study.
If you want to go much deeper into causal inference, I recommend Hernán and Robins’ Causal Inference: What If.
Enjoyed this? Subscribe to my newsletter.
I write about open science, research code, and building better tools for researchers.